The global pre-engineered buildings market is expected to grow from USD 6.36 billion in 2019 to USD 11.38 billion by 2027, at a CAGR of 7.39% during the forecast period from 2020-2027. Increasing demand for green buildings and the need for reducing construction time and cost, along with the demand for lightweight building structure, are some of the key factors propelling the growth of the market.
The major demand for pre-engineered buildings in the Asia Pacific region is contributed by India and China, owing to the growing population, economic growth, government investments, and demand for low-cost green buildings, further boosting the growth of the market. In addition to this, rapid urbanization and an increase in the use of steel in building and construction projects, fuelling the growth of the market. Vulnerability to corrosion, lower thermal conductivity, and lack of skilled manpower, are some of the key factors hampering the growth of the market.
The pre-engineered buildings market has been segmented on the basis of type, application, and region. The type segment includes prefabricated steel structure construction and prefabricated reinforced concrete construction. The prefabricated steel structure construction segment held the largest market share of 68.68% and valued at USD 4.33 billion in 2019, due to ease of handling and less maintenance is needed. Prefabricated steel structure construction provides lower weight reduces foundation requirement, highly recycled and can be continued to be recycled, and durable if protected from corrosion.
The application segment includes public buildings and residential construction. Public buildings segment held the largest market share of 57.78% in 2019, due advantages for the public buildings that include great flexibility in design to suit the application, open floor plans are possible due to the capability of the steel frame to span large spaces without intermediate supports, building structure arrives at the job ready to erect, reducing building time, and delays due to weather are less.
The market has been divided into North America, Europe, Asia-Pacific, South America, and the Middle East and Africa. Asia-Pacific held the largest market share of 43.71% in 2019. The region is expected to show rapid economic and infrastructural growth. With a lot of investments in the regions of China and India, the construction sector is growing. The inflow of foreign investment in India further augments the market for pre-engineered buildings.
Key players in the pre-engineered buildings market are Tata BlueScope Steel, Kirby Building Systems, Interarch Building Products, Jindal Buildsys Limited, Era Infra, Everest Industries, Lloyd Insulations, Multicolour Steels, PEBS Pennar, SML Group, Smith Structures, and Tiger Steel Engineering among others. Developing and developed countries are offering greater opportunities and major players are continuously focused on new developments, strategic partnerships, acquisitions, and venture capital investments to obtain high growth in the market. In October 2017, Everest Steel Building Solutions, the Pre-Engineered Building division of Everest Industries Ltd launched the pre-engineered building (PEB) products for designing, detailing, fabrication and erection of metal buildings.
This study forecasts revenue growth at global, regional, and country levels from 2013 to 2027. Fior Markets has segmented on the basis of below-mentioned segments:
Chapter 1 Introduction 15
1.1 Research Methodology 15
1.2 FMR Desk Research 16
1.2.1 FMR Data Synthesis 17
1.2.2 Data Validation And Market Feedback 17
1.2.3 FMR Data Sources 18
Chapter 2 Global Pre-Engineered Buildings Market Overview 20
2.1 Pre-Engineered Buildings Market Overview 20
2.1.1 Pre-Engineered Buildings Product Scope 20
2.1.2 Market Status and Outlook 23
2.2 Global Pre-Engineered Buildings Market Size and Analysis by Regions (2013-2018) 24
2.2.1 North America Pre-Engineered Buildings Market Status and Outlook 26
2.2.2 Europe Pre-Engineered Buildings Market Status and Outlook 27
2.2.3 Asia-Pacific Pre-Engineered Buildings Market Status and Outlook 28
2.2.4 Central & South America Pre-Engineered Buildings Market Status and Outlook 29
2.2.5 Middle East & Africa Pre-Engineered Buildings Market Status and Outlook 30
2.3 Classification of Pre-engineered Buildings by Product 31
2.3.1 Global Pre-engineered Buildings Revenue (Million USD) and Growth (%) Comparison by Product (2013-2027) 31
2.3.2 Global Pre-engineered Buildings Revenue (Million USD) Market Share (%) by Product in 2017 33
2.3.3 Prefabricated Steel Structure Construction 34
2.3.4 Prefabricated Reinforced Concrete Construction 36
2.4 Global Pre-engineered Buildings Market by End Users/Application 38
2.4.1 Public Buildings 40
2.4.2 Residential Construction 42
Chapter 3 Global Pre-engineered Buildings Competition Analysis by Players 44
3.1.1 Global Pre-engineered Buildings Market Size (Million USD) by Players (2013-2018) 44
3.2 Competitive Status 47
3.3 Porter's Five Forces 48
Chapter 4 Manufacturers Profiles 49
4.1 Tata BlueScope Steel Limited (subsidiary of BlueScope Steel) 49
4.1.1 Company Profile 49
4.1.2 Business Overview 50
4.1.3 Products, Services and Solutions 51
4.1.4 Tata BlueScope Steel Pre-engineered Buildings Revenue (Million USD) (2013-2018) 52
4.1.5 Recent Developments 53
4.1.6 SWOT Analysis 54
4.2 Kirby Building Systems ( Subsidiary of Alghanim Industries) 55
4.2.1 Company Profile 55
4.2.2 Business Overview 56
4.2.3 Products, Services and Solutions 57
4.2.4 Kirby Building Systems Pre-engineered Buildings Revenue (Million USD) (2013-2018) 58
4.2.5 Developments 59
4.2.6 SWOT Analysis 60
4.3 Interarch Building Products Pvt. Ltd 61
4.3.1 Company Profile 61
4.3.2 Business Overview 62
4.3.3 Products, Services and Solutions 63
4.3.4 Interarch Building Products Pvt. Ltd Pre-engineered Buildings Revenue (Million USD) (2013-2018) 64
4.3.5 Recent Developments 66
4.3.6 SWOT Analysis 66
4.4 Jindal Buildsys Ltd 67
4.4.1 Company Profile 67
4.4.2 Business Overview 68
4.4.3 Products, Services and Solutions 69
4.4.4 Recent Developments 70
4.4.5 SWOT Analysis 70
4.5 Era Buildsys Limit 71
4.5.1 Company Profile 71
4.5.2 Business Overview 72
4.5.3 Products, Services and Solutions 73
4.5.4 Era Buildsys Limit Pre-engineered Buildings Revenue (Million USD) (2013-2018) 75
4.5.5 Recent Developments 76
4.5.6 SWOT Analysis 77
4.6 Everest 78
4.6.1 Company Profile 78
4.6.2 Business Overview 79
4.6.3 Products, Services and Solutions 80
4.6.4 Everest Pre-engineered Buildings Revenue (Million USD) (2013-2018) 81
4.6.5 Recent Developments 82
4.6.6 SWOT Analysis 83
4.7 Lloyd Insulations 84
4.7.1 Company Profile 84
4.7.2 Business Overview 85
4.7.3 Products, Services and Solutions 86
4.7.4 SWOT Analysis 87
4.8 Multicolor Steels (India) Pvt. Ltd. 88
4.8.1 Company Profile 88
4.8.2 Business Overview 89
4.8.3 Products, Services and Solutions 90
4.8.1 Recent Developments 91
4.8.2 SWOT Analysis 91
4.9 SML Group 92
4.9.1 Company Profile 92
4.9.2 Business Overview 93
4.9.3 Products, Services and Solutions 94
4.9.4 Recent Developments 95
4.9.5 SWOT Analysis 95
4.10 Smith Structures. 96
4.10.1 Company Profile 96
4.10.2 Business Overview 97
4.10.3 Products, Services and Solutions 98
4.10.4 Recent Developments 99
4.10.5 SWOT Analysis 99
4.11 Tiger Steel Engineering (India) Pvt. Ltd 100
4.11.1 Company Profile 100
4.11.2 Business Overview 101
4.11.3 Products, Services and Solutions 102
4.11.4 Recent Developments 103
4.11.5 SWOT Analysis 103
4.12 Zamil Steel Pre-Engineered Buildings Co. Ltd. (subsidiary of Zamil Industrial Investment Company) 104
4.12.1 Company Profile 104
4.12.2 Business Overview 105
4.12.3 Products, Services and Solutions 106
4.12.4 Zamil Steel Pre-Engineered Buildings Co. Ltd. Pre-engineered Buildings Revenue (Million USD) (2013-2018) 106
4.12.5 Recent Developments 109
4.12.6 SWOT Analysis 109
4.13 Nucor Corporation 110
4.13.1 Company Profile 110
4.13.2 Business Overview 111
4.13.3 Products, Services and Solutions 112
4.13.4 Nucor Corporation Pre-engineered Buildings Revenue (Million USD) (2013-2018) 112
4.13.5 Recent Developments 115
4.13.6 SWOT Analysis 115
4.14 Memaar Building Systems FZC (a subsidiary of Emaar Industries and Investments) 116
4.14.1 Company Profile 116
4.14.2 Business Overview 117
4.14.3 Products, Services and Solutions 118
4.14.4 Recent Developments 119
4.14.5 SWOT Analysis 119
4.15 Apex Buildsys Limited 120
4.15.1 Company Profile 120
4.15.2 Business Overview 121
4.15.3 Products, Services and Solutions 122
4.15.4 SWOT Analysis 122
Chapter 5 Global Pre-engineered Buildings Market Size by Product and Application (2013-2018) 123
5.1 Global Pre-engineered Buildings Market Size by Product (2013-2018) 123
5.2 Global Pre-engineered Buildings Market Size by Application (2013-2018) 126
5.3 Potential Application of Pre-engineered Buildings in Future 129
5.3.1 Reduced construction & initial costs 129
5.3.2 Quick & easy to design 129
5.3.3 Time-saving metal building kits 129
5.3.4 Durable & long lasting 130
5.3.5 Easy on the environment & energy efficient 130
5.4 Top Consumer / End Users of Pre-engineered Buildings 131
Chapter 6 North America Pre-engineered Buildings Development Status and Outlook 132
6.1 North America Pre-engineered Buildings Market Size (2013-2018) 132
6.2 North America Pre-engineered Buildings Market Size and Market Share by Players (2013-2018) 133
6.3 North America Pre-engineered Buildings Market Size by Application (2013-2018) 136
Chapter 7 Europe Pre-engineered Buildings Development Status and Outlook 140
7.1 Europe Pre-engineered Buildings Market Size (2013-2018) 140
7.2 Europe Pre-engineered Buildings Market Size and Market Share by Players (2013-2018) 141
7.3 Europe Pre-engineered Buildings Market Size by Application (2013-2018) 144
Chapter 8 Asia-Pacific Pre-engineered Buildings Development Status and Outlook 148
8.1 Asia-Pacific Pre-engineered Buildings Market Size (2013-2018) 148
8.2 Asia-Pacific Pre-engineered Buildings Market Size and Market Share by Players (2013-2018) 149
8.3 Asia-Pacific Pre-engineered Buildings Market Size by Application (2013-2018) 152
Chapter 9 Central & South America Pre-engineered Buildings Development Status and Outlook 157
9.1 Central & South America Pre-engineered Buildings Market Size (2013-2018) 157
9.2 Central & South America Pre-engineered Buildings Market Size by Application (2013-2018) 158
Chapter 10 Middle East & Africa Pre-engineered Buildings Development Status and Outlook 162
10.1 Middle East & Africa Pre-engineered Buildings Market Size (2013-2018) 162
10.2 Middle East & Africa Pre-engineered Buildings Market Size by Application (2013-2018) 163
Chapter 11 Pre-engineered Buildings Market Dynamics 167
11.1 Pre-engineered Buildings Market Opportunities 167
11.2 Pre-engineered Buildings Challenge and Risk 168
11.3 Pre-engineered Buildings Market Constraints and Threat 168
11.3.1 Substitutes Threat 168
11.3.2 Government Policy 168
11.3.3 Technology Risks 169
11.4 Pre-engineered Buildings Market Driving Force 170
11.4.1 Growing Demand from Emerging Markets 170
11.4.2 Potential Application 170
Chapter 12 Market Forecast by Regions, Product and Application (2018-2027) 172
12.1 Global Pre-engineered Buildings Market Size (Million USD) by Regions (2018-2027) 173
12.1.1 North America Pre-engineered Buildings Revenue and Growth Rate (2018-2027) 176
12.1.2 Europe Pre-engineered Buildings Revenue and Growth Rate (2018-2027) 177
12.1.3 Asia-Pacific Pre-engineered Buildings Revenue and Growth Rate (2018-2027) 178
12.1.4 Central & Central & South America Pre-engineered Buildings Revenue and Growth Rate (2018-2027) 179
12.1.5 Middle East and Africa Pre-engineered Buildings Revenue and Growth Rate (2018-2027) 180
12.2 Global Pre-engineered Buildings Market Size by Application (2018-2027) 181
12.3 Global Pre-engineered Buildings Market Size by Product (2018-2027) 184
Chapter 13 Research Finding /Conclusion 187
List of Figures
FIG. 1 Product Picture of Global Pre-Engineered Buildings 22
FIG. 2 Global Pre-Engineered Buildings Market Size (Million USD) Status and Outlook (2013-2027) 23
FIG. 3 Global Pre-Engineered Buildings Market Share by Regions (2013-2018) 25
FIG. 4 North America Pre-Engineered Buildings Market Size (Million USD) and Growth Rate (2013-2018) 26
FIG. 5 Europe Pre-Engineered Buildings Market Size (Million USD) and Growth Rate (2013-2018) 27
FIG. 6 Asia-Pacific Pre-Engineered Buildings Market Size (Million USD) and Growth Rate (2013-2018) 28
FIG. 7 Central & South America Pre-Engineered Buildings Market Size (Million USD) and Growth Rate (2013-2018) 29
FIG. 8 Middle East & Africa Pre-Engineered Buildings Market Size (Million USD) and Growth Rate (2013-2018) 30
FIG. 9 Global Pre-engineered Buildings Revenue (Million USD) Comparison by Product (2013-2027) 32
FIG. 10 Global Pre-engineered Buildings Revenue Market Share (%) by Product in 2017 33
FIG. 11 Prefabricated Steel Structure Construction Market Size (Million USD) and Growth Rate (2013-2018) 35
FIG. 12 Prefabricated Reinforced Concrete Construction Market Size (Million USD) and Growth Rate (2013-2018) 37
FIG. 13 Global Pre-engineered Buildings Market Share by Application in 2017 39
FIG. 14 Pre-engineered Buildings Market Size (Million USD) and Growth Rate in Public Buildings (2013-2018) 41
FIG. 15 Prefabricated Reinforced Concrete Construction Market Size (Million USD) and Growth Rate (2013-2018) 43
FIG. 16 Global Pre-engineered Buildings Market Size Share by Players in 2017 46
FIG. 17 Global Top 5 Players Pre-engineered Buildings Market Share in 2017 47
FIG. 18 Porter's Five Forces 48
FIG. 19 Tata BlueScope Steel Pre-engineered Buildings Business Revenue Growth Rate 52
FIG. 20 Tata BlueScope Steel Pre-engineered Buildings Business Revenue Market Share (%) (2013-2018) 53
FIG. 21 Kirby Building Systems Pre-engineered Buildings Business Revenue Growth Rate 58
FIG. 22 Kirby Building Systems Pre-engineered Buildings Business Revenue Market Share (%) (2013-2018) 59
FIG. 23 Interarch Building Products Pvt. Ltd Pre-engineered Buildings Business Revenue Growth Rate 64
FIG. 24 Interarch Building Products Pvt. Ltd Pre-engineered Buildings Business Revenue Market Share (%) (2013-2018) 65
FIG. 25 Era Buildsys Limit Pre-engineered Buildings Business Revenue Growth Rate 75
FIG. 26 Era Buildsys Limit Pre-engineered Buildings Business Revenue Market Share (%) (2013-2018) 76
FIG. 27 Everest Pre-engineered Buildings Business Revenue Growth Rate 81
FIG. 28 Everest Pre-engineered Buildings Business Revenue Market Share (%) (2013-2018) 82
FIG. 29 Zamil Steel Pre-Engineered Buildings Co. Ltd. Pre-engineered Buildings Business Revenue Growth Rate 107
FIG. 30 Zamil Steel Pre-Engineered Buildings Co. Ltd. Pre-engineered Buildings Business Revenue Market Share (%) (2013-2018) 108
FIG. 31 Nucor Corporation Pre-engineered Buildings Business Revenue Growth Rate 113
FIG. 32 Nucor Corporation Pre-engineered Buildings Business Revenue Market Share (%) (2013-2018) 114
FIG. 33 Global Pre-engineered Buildings Revenue Market Share (%) by Product (2013-2018) 124
FIG. 34 Global Pre-engineered Buildings Market Size Share by Product in 2017 125
FIG. 35 Global Pre-engineered Buildings Revenue Market Share (%) by Application (2013-2018) 127
FIG. 36 Global Pre-engineered Buildings Market Size Share by Application in 2017 128
FIG. 37 North America Pre-engineered Buildings Market Size and Growth Rate (2013-2018) 132
FIG. 38 North America Pre-engineered Buildings Market Size by Players in 2017 134
FIG. 39 North America Pre-engineered Buildings Market Size Share by Players in 2017 135
FIG. 40 North America Pre-engineered Buildings Revenue Market Share (%) by Application (2013-2018) 137
FIG. 41 North America Pre-engineered Buildings Market Size Share by Application in 2017 138
FIG. 42 Europe Pre-engineered Buildings Market Size and Growth Rate (2013-2018) 140
FIG. 43 Europe Pre-engineered Buildings Market Size by Players in 2017 142
FIG. 44 Europe Pre-engineered Buildings Market Size Share by Players in 2017 143
FIG. 45 Europe Pre-engineered Buildings Revenue Market Share (%) by Application (2013-2018) 145
FIG. 46 Europe Pre-engineered Buildings Market Size Share by Application in 2017 146
FIG. 47 Asia-Pacific Pre-engineered Buildings Market Size and Growth Rate (2013-2018) 148
FIG. 48 Asia-Pacific Pre-engineered Buildings Market Size by Players in 2017 150
FIG. 49 Asia-Pacific Pre-engineered Buildings Market Size Share by Players in 2017 151
FIG. 50 Asia-Pacific Pre-engineered Buildings Revenue Market Share (%) by Application (2013-2018) 153
FIG. 51 Asia-Pacific Pre-engineered Buildings Market Size Share by Application in 2017 154
FIG. 52 Central & South America Pre-engineered Buildings Market Size and Growth Rate (2013-2018) 157
FIG. 53 Central & South America Pre-engineered Buildings Revenue Market Share (%) by Application (2013-2018) 159
FIG. 54 Central & South America Pre-engineered Buildings Market Size Share by Application in 2017 160
FIG. 55 Middle East & Africa Pre-engineered Buildings Market Size and Growth Rate (2013-2018) 162
FIG. 56 Middle East & Africa Pre-engineered Buildings Revenue Market Share (%) by Application (2013-2018) 164
FIG. 57 Middle East & Africa Pre-engineered Buildings Market Size Share by Application in 2017 165
FIG. 58 Global Pre-engineered Buildings Market Size and Growth Rate (Value) (2018-2027) 172
FIG. 59 Global Pre-engineered Buildings Market Size Share by Regions (2018-2027) 174
FIG. 60 Global Pre-engineered Buildings Market Size Share by Regions in 2027 175
FIG. 61 North America Pre-engineered Buildings Revenue (Million USD) and Growth Rate (2018-2027) 176
FIG. 62 Europe Pre-engineered Buildings Revenue (Million USD) and Growth Rate (2018-2027) 177
FIG. 63 Asia-Pacific Pre-engineered Buildings Revenue (Million USD) and Growth Rate (2018-2027) 178
FIG. 64 Central & Central & South America Pre-engineered Buildings Revenue (Million USD) and Growth Rate (2018-2027) 179
FIG. 65 Middle East and Africa Pre-engineered Buildings Revenue (Million USD) and Growth Rate (2018-2027) 180
FIG. 66 Global Pre-engineered Buildings Market Size by Application (2018-2027) 182
FIG. 67 Global Pre-engineered Buildings Market Size by Application 2027 183
FIG. 68 Global Pre-engineered Buildings Market Size by Product (2018-2027) 185
FIG. 69 Global Pre-engineered Buildings Market Size by Product 2027 186
List of Tables
TABLE 1 Global Market Pre-Engineered Buildings Revenue (Million USD) Comparison by Regions 2013-2027 24
TABLE 2 Global Pre-engineered Buildings Revenue (Million USD) and Growth Rate (%) Comparison by Product (2013-2027) 31
TABLE 3 Global Pre-engineered Buildings Revenue (Million USD) and Growth Rate (%) Comparison by Application (2013-2027) 38
TABLE 4 Global Pre-engineered Buildings Revenue (Million USD) by Players (2013-2018) 44
TABLE 5 Global Pre-engineered Buildings Revenue Market Share (Million USD) by Players (2013-2018) 45
TABLE 6 Tata BlueScope Steel Basic Information List 49
TABLE 7 Pre-engineered Buildings Business Revenue of Tata BlueScope Steel (2013-2018) 52
TABLE 8 Kirby Building Systems Basic Information List 55
TABLE 9 Pre-engineered Buildings Business Revenue of Kirby Building Systems (2013-2018) 58
TABLE 10 Interarch Building Products Pvt. Ltd Basic Information List 61
TABLE 11 Pre-engineered Buildings Business Revenue of Interarch Building Products Pvt. Ltd (2013-2018) 64
TABLE 12 Jindal Buildsys Ltd Basic Information List 67
TABLE 13 Era Buildsys Limit Basic Information List 71
TABLE 14 Pre-engineered Buildings Business Revenue of Era Buildsys Limit (2013-2018) 75
TABLE 15 Everest Basic Information List 78
TABLE 16 Pre-engineered Buildings Business Revenue of Everest (2013-2018) 81
TABLE 17 Lloyd Insulations Basic Information List 84
TABLE 18 Multicolor Steels (India) Pvt. Ltd. Basic Information List 88
TABLE 19 SML Group Basic Information List 92
TABLE 20 Smith Structures. Basic Information List 96
TABLE 21 Tiger Steel Engineering (India) Pvt. Ltd Basic Information List 100
TABLE 22 Zamil Steel Pre-Engineered Buildings Co. Ltd. Basic Information List 104
TABLE 23 Pre-engineered Buildings Business Revenue of Zamil Steel Pre-Engineered Buildings Co. Ltd. (2013-2018) 106
TABLE 24 Nucor Corporation Basic Information List 110
TABLE 25 Pre-engineered Buildings Business Revenue of Nucor Corporation (2013-2018) 112
TABLE 26 Memaar Building Systems FZC Basic Information List 116
TABLE 27 Apex Buildsys Limited Basic Information List 120
TABLE 28 Global Pre-Engineered Buildings Market Size by Product (2013-2018) 123
TABLE 29 Global Pre-Engineered Buildings Market Size by Application (2013-2018) 126
TABLE 30 Different Top Consumer / End Users of Pre-engineered Buildings 131
TABLE 31 North America Pre-Engineered Buildings Market Size by Player (2013-2018) 133
TABLE 32 North America Pre-Engineered Buildings Market Size by Application(2013-2018) 136
TABLE 33 North America Pre-Engineered Buildings Market Size by Country(2013-2018) 139
TABLE 34 North America Pre-Engineered Buildings Market Share by Country(2013-2018) 139
TABLE 35 Europe Pre-Engineered Buildings Market Size by Player (2013-2018) 141
TABLE 36 Europe Pre-Engineered Buildings Market Size by Application(2013-2018) 144
TABLE 37 Europe Pre-Engineered Buildings Market Size by Country(2013-2018) 147
TABLE 38 Europe Pre-Engineered Buildings Market Share by Country(2013-2018) 147
TABLE 39 Asia-Pacific Pre-Engineered Buildings Market Size by Player (2013-2018) 149
TABLE 40 Asia-Pacific Pre-Engineered Buildings Market Size by Application(2013-2018) 152
TABLE 41 Asia-Pacific Pre-Engineered Buildings Market Size by Country(2013-2018) 155
TABLE 42 Asia-Pacific Pre-Engineered Buildings Market Share by Country(2013-2018) 156
TABLE 43 Central & South America Pre-Engineered Buildings Market Size by Application(2013-2018) 158
TABLE 44 Central & South America Pre-Engineered Buildings Market Size by Country(2013-2018) 161
TABLE 45 Central & South America Pre-Engineered Buildings Market Share by Country(2013-2018) 161
TABLE 46 Middle East & Africa Pre-Engineered Buildings Market Size by Application(2013-2018) 163
TABLE 47 Middle East & Africa Pre-Engineered Buildings Market Size by Country(2013-2018) 166
TABLE 48 Middle East & Africa Pre-Engineered Buildings Market Share by Country(2013-2018) 166
TABLE 49 Global Pre-engineered Buildings Market Size by Regions (2018-2027) 173
TABLE 50 Global Pre-engineered Buildings Market Size by Application (2018-2027) 181
TABLE 51 Global Pre-engineered Buildings Market Size by Product (2018-2027) 184
Market research is a method of gathering, assessing and deducing data & information about a particular market. Market research is very crucial in these days. The techniques analyze about how a product/service can be offered to the market to its end-customers, observe the impact of that product/service based on the past customer experiences, and cater their needs and demands. Owing to the successful business ventures, accurate, relevant and thorough information is the base for all the organizations because market research report/study offers specific market related data & information about the industry growth prospects, perspective of the existing customers, and the overall market scenario prevailed in past, ongoing present and developing future. It allows the stakeholders and investors to determine the probability of a business before committing substantial resources to the venture. Market research helps in solving the marketing issues challenges that a business will most likely face.
Market research is valuable because of the following reasons:
Our research report features both the aspects; qualitative and quantitative. Qualitative part provides insights about the market driving forces, potential opportunities, customer’s demands and requirement which in turn help the companies to come up with new strategies in order to survive in the long run competition. The quantitative segment offers the most credible information related to the industry. Based on the data gathering, we use to derive the market size and estimate their future growth prospects on the basis of global, region and country.
Our market research process involves with the four specific stages.
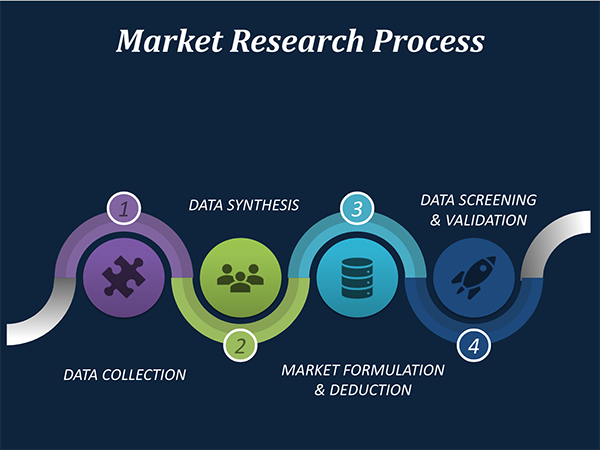
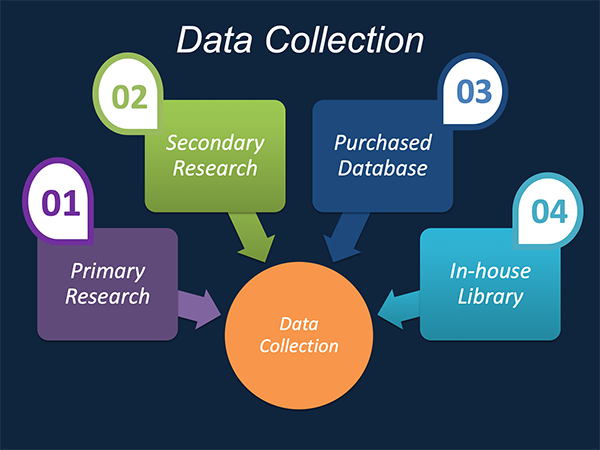
Data Collection: This stage of the market research process involves with the gathering and collecting of the market/industry related data from the sources. There are basically two types of research methods:
Data Synthesis: This stage includes the evaluation and assessment of all the data acquired from the primary and secondary research. It likewise includes in evaluating the information for any disparity watched while information gathering identified with the market. The data & information is gathered with consideration to the heterogeneity of sources. Scientific and statistical methods are implemented for synthesizing dissimilar information sets and provide the relevant data which is fundamental for formulating strategies. Our organization has broad involvement with information amalgamation where the information goes through different stages:
Market Formulation & Deduction: The last stage includes assigning the data & information in a suitable way in order to derive market size. Analyst reviews and domain based opinions based on holistic approach of market estimation combined with industry investigation additionally features a crucial role in this stage.
This stage includes with the finalization of the market size and numbers that we have gathered from primary and secondary research. With the data & information addition, we ensure that there is no gap in the market information. Market trend analysis is finished by our analysts by utilizing data extrapolation procedures, which give the most ideal figures to the market.
Data Validation: Validation is the most crucial step in the process. Validation & re-validation through scientifically designed technique and process that helps us finalize data-points to be used for final calculations. This stage also involves with the data triangulation process. Data triangulation generally implicates the cross validation and matching the data which has been collected from primary and secondary research methods.




































Free Customization
Countries can be added on demand
Free yearly update on purchase of Multi/Corporate User License
Companies served till date

We serve our customers 24x7 for 365 days through calls, emails and live chat options.

Huge database of exceptional market reports bringing market intelligence to your fingertips.

SSL enabled, we offer you various secured payment options for risk free purchase.