Global Low GWP Refrigerants market is expected to reach USD 35.7 Billion by 2025 at a CAGR of 12.1% during the forecast period from 2018-2025. Less impact on the environment through low GWP refrigerant and rising demand for refrigeration and air-conditioning application are the key contributors to the market.
Market Overview:
The Global Warming Potential (GWP) is defined as a degree of a greenhouse gas released into the atmosphere and benchmarked against CO2 which has a GWP equal to one. It is a measure of the potency of a greenhouse gas relative to carbon dioxide (where carbon dioxide has a GWP value of 1). The HFC refrigerants generally used today have GWP values that are thousands of times larger than that of carbon dioxide. The use of the refrigerants with low global warming potential (GWP) helps to reduce the effect of the refrigeration systems on global warming. In the future, when GWP values decrease due to phase-downs and energy efficiency demands (MEPS) increase, HVACR professionals will focus on using components that allow for the lowest possible charge and technologies with the best cost/performance for a given refrigerant type.
Report Description:
Market Dynamics:
Drivers:
Restraints:
Opportunities:
Challenges:
Global Low GWP Refrigerants Market Key Findings:
All the segments have been analyzed on global, regional and country basis. The study includes an analysis of more than 30 countries for each segment.
Segmentation Analysis:
The low GWP refrigerants market is segmented by type and application
Regional Segmentation Analysis:
The regions analyzed for the market include North America, Europe, South America, Asia Pacific, and the Middle East and Africa. Europe region dominated the global Low GWP Refrigerants market with USD 5.84 Billion in 2017 whereas the North America region held the second dominant position in the market.
Global Low GWP Refrigerants Market Competitive Analysis:
Key players in the Low GWP Refrigerants market are Linde Group, Honeywell, Sinochem Group, Airgas Inc., Engas Australasia, A-Gas, and Puyang Zhongwei Fine Chemical¸ Harp International, Tazzetti, Shandong Yueon Chemical Industry, GTS, Chemours, Mexichem, Daikin and Arkema. For instance, The Linde Group, the market leader in the low GWP refrigerants market, invested USD 33.70 Billion to expand production capacity and meet growing customer demands in Malaysia
This study forecasts revenue and volume growth at global, regional, and country levels from 2015 to 2025. Fior Market Research has segmented the global low GWP refrigerants market by below-mentioned segments:
Global Low GWP Refrigerants Market, By Type:
Global Low GWP Refrigerants Market, By Application:
Global Low GWP Refrigerants Market, By Regions:
*All our reports are customizable as per customer requirements
1. Introduction
1.1. Objectives of the Study
1.2. Market Definition
1.3. Research Scope
1.4. Currency
2. Research Methodology and Assumptions
3. Executive Summary
4. Premium Insights
4.1. Porter’s Five Forces Analysis
4.2. Value Chain Analysis
4.3. Top Investment Pockets
4.3.1. Market attractiveness analysis by Type
4.3.2. Market attractiveness analysis by Application
4.3.3. Market attractiveness analysis by Region
4.4. Industry Trends
5. Market Dynamics
5.1. Market Evaluation
5.2. Drivers
5.2.1. Less effect on environment with the use of low GWP refrigerants
5.2.2. Striking out the use of CFC, CFC, and HFC refrigerants
5.2.3. Long-Term application of low GWP refrigerants
5.2.4. Growing demand for refrigeration and air-conditioning application
5.3. Restraints
5.3.1. Involves high capital cost
5.3.2. Due to its properties like flammability and toxicity, it suffers a major drawback
5.4. Opportunities
5.4.1. Combats global warming
5.4.2. Less cost of operation and better performance due to technological improvement
5.5. Challenges
5.5.1. Lack of purification companies
5.5.2. Less education and awareness in HVAC contractors and technicians
6. Global Low GWP Refrigerants Market Analysis and Forecast, By Type
6.1. Segment Overview
6.2. Inorganics
6.2.1. Ammonia
6.2.2. Carbon Di-Oxide
6.2.3. Others
6.3. Fluorocarbons
6.3.1. HFOC
6.3.2. HFCS
6.4. Hydrocarbons
6.4.1. Propane
6.4.2. Isobutane
6.4.3. Others
7. Global Low GWP Refrigerants Market Analysis and Forecast, By Application
7.1. Segment Overview
7.2. Commercial Refrigeration
7.3. Industrial Refrigeration
7.4. Domestic Refrigeration
7.5. Stationary Air-Conditioning
7.6. Mobile Air-Conditioning
7.7. Others
8. Global Low GWP Refrigerants Market Analysis and Forecast, By Regional Analysis
8.1. Segment Overview
8.2. North America
8.2.1. U.S.
8.2.2. Canada
8.2.3. Mexico
8.3. Europe
8.3.1. Germany
8.3.2. France
8.3.3. Sweden
8.3.4. Netherlands
8.3.5. U.K.
8.3.6. Italy
8.3.7. Spain
8.3.8. Turkey
8.3.9. Switzerland
8.3.10. Belgium
8.3.11. Rest of Europe
8.4. Asia-Pacific
8.4.1. Japan
8.4.2. China
8.4.3. India
8.4.4. South Korea
8.4.5. Australia
8.4.6. Singapore
8.4.7. Malaysia
8.4.8. Thailand
8.4.9. Indonesia
8.4.10. Philippines
8.4.11. Rest of Asia-Pacific
8.5. South America
8.5.1. Brazil
8.5.2. Argentina
8.5.3. Colombia
8.5.4. Rest of South America
8.6. Middle East and Africa
8.6.1. Saudi Arabia
8.6.2. UAE
8.6.3. Egypt
8.6.4. Nigeria
8.6.5. South Africa
8.6.6. Rest of Middle East and Africa
9. Global Low GWP Refrigerants Market-Competitive Landscape
9.1. Overview
9.2. Market Share of Key Players in the Low GWP Refrigerants Market
9.2.1. Global Company Market Share
9.2.2. North America Company Market Share
9.2.3. Europe Company Market Share
9.2.4. APAC Company Market Share
9.3. Competitive Situations and Trends
9.3.1. Application Launches and Developments
9.3.2. Partnerships, Collaborations, and Agreements
9.3.3. Mergers & Acquisitions
9.3.4. Expansions
10. Company Profiles
10.1. Linde Group
10.1.1. Business Overview
10.1.2. Company Snapshot
10.1.3. Company Market Share Analysis
10.1.4. Company Application Portfolio
10.1.5. Recent Developments
10.1.6. SWOT Analysis
10.2. Honeywell
10.2.1. Business Overview
10.2.2. Company Snapshot
10.2.3. Company Market Share Analysis
10.2.4. Company Application Portfolio
10.2.5. Recent Developments
10.2.6. SWOT Analysis
10.3. Sinochem Group
10.3.1. Business Overview
10.3.2. Company Snapshot
10.3.3. Company Market Share Analysis
10.3.4. Company Application Portfolio
10.3.5. Recent Developments
10.3.6. SWOT Analysis
10.4. Airgas Inc
10.4.1. Business Overview
10.4.2. Company Snapshot
10.4.3. Company Market Share Analysis
10.4.4. Company Application Portfolio
10.4.5. Recent Developments
10.4.6. SWOT Analysis
10.5. Engas Australasia
10.5.1. Business Overview
10.5.2. Company Snapshot
10.5.3. Company Market Share Analysis
10.5.4. Company Application Portfolio
10.5.5. Recent Developments
10.5.6. SWOT Analysis
10.6. A-Gas
10.6.1. Business Overview
10.6.2. Company Snapshot
10.6.3. Company Market Share Analysis
10.6.4. Company Application Portfolio
10.6.5. Recent Developments
10.6.6. SWOT Analysis
10.7. Puyang Zhongwei Fine Chemical
10.7.1. Business Overview
10.7.2. Company Snapshot
10.7.3. Company Market Share Analysis
10.7.4. Company Application Portfolio
10.7.5. Recent Developments
10.7.6. SWOT Analysis
10.8. Harp International
10.8.1. Business Overview
10.8.2. Company Snapshot
10.8.3. Company Market Share Analysis
10.8.4. Company Application Portfolio
10.8.5. Recent Developments
10.8.6. SWOT Analysis
10.9. Tazzetti
10.9.1. Business Overview
10.9.2. Company Snapshot
10.9.3. Company Market Share Analysis
10.9.4. Company Application Portfolio
10.9.5. Recent Developments
10.9.6. SWOT Analysis
10.10. Shandong Yueon Chemical Industry
10.10.1. Business Overview
10.10.2. Company Snapshot
10.10.3. Company Market Share Analysis
10.10.4. Company Application Portfolio
10.10.5. Recent Developments
10.10.6. SWOT Analysis
10.11. GTS
10.11.1. Business Overview
10.11.2. Company Snapshot
10.11.3. Company Market Share Analysis
10.11.4. Company Application Portfolio
10.11.5. Recent Developments
10.11.6. SWOT Analysis
10.12. Chemours
10.12.1. Business Overview
10.12.2. Company Snapshot
10.12.3. Company Market Share Analysis
10.12.4. Company Application Portfolio
10.12.5. Recent Developments
10.12.6. SWOT Analysis
10.13. Mexichem
10.13.1. Business Overview
10.13.2. Company Snapshot
10.13.3. Company Market Share Analysis
10.13.4. Company Application Portfolio
10.13.5. Recent Developments
10.13.6. SWOT Analysis
10.14. Daikin
10.14.1. Business Overview
10.14.2. Company Snapshot
10.14.3. Company Market Share Analysis
10.14.4. Company Application Portfolio
10.14.5. Recent Developments
10.14.6. SWOT Analysis
10.15. Arkema
10.15.1. Business Overview
10.15.2. Company Snapshot
10.15.3. Company Market Share Analysis
10.15.4. Company Application Portfolio
10.15.5. Recent Developments
10.15.6. SWOT Analysis
List of Table
1. Global Low GWP Refrigerants Market, By Type, 2015–2025 (USD Billion) (Kilotons)
2. Global Low GWP Refrigerants Market, By Inorganics, 2015–2025 (USD Billion) (Kilotons)
3. Global Low GWP Refrigerants Market, By Fluorocarbons, 2015–2025 (USD Billion) (Kilotons)
4. Global Low GWP Refrigerants Market, By Hydrocarbons, 2015–2025 (USD Billion) (Kilotons)
5. Global Inorganics Low GWP Refrigerants Market, By Region, 2015–2025 (USD Billion) (Kilotons)
6. Global Fluorocarbons Low GWP Refrigerants Market, By Region, 2015–2025 (USD Billion) (Kilotons)
7. Global Hydrocarbons Low GWP Refrigerants Market, By Region, 2015–2025 (USD Billion) (Kilotons)
8. Global Low GWP Refrigerants Market, By Application, 2015–2025 (USD Billion) (Kilotons)
9. Global Commercial Refrigeration Low GWP Refrigerants Market, BY Region, 2015–2025 (USD Billion) (Kilotons)
10. Global Industrial Refrigeration Low GWP Refrigerants Market, By Region, 2015–2025 (USD Billion) (Kilotons)
11. Global Domestic Refrigeration Low GWP Refrigerants Market, By Region, 2015–2025 (USD Billion) (Kilotons)
12. Global Stationary Air-Conditioning Low GWP Refrigerants Market, By Region, 2015–2025 (USD Billion) (Kilotons)
13. Global Mobile Air-Conditioning Low GWP Refrigerants Market, By Region, 2015–2025 (USD Billion) (Kilotons)
14. Global Others Low GWP Refrigerants Market, By Region, 2015–2025 (USD Billion) (Kilotons)
15. Global Low GWP Refrigerants Market, By Region, 2015–2025 (USD Billion) (Kilotons)
16. North America Low GWP Refrigerants Market, By Type, 2015–2025 (USD Billion) (Kilotons)
17. North America Low GWP Refrigerants Market, By Application, 2015–2025 (USD Billion) (Kilotons)
18. U.S. Low GWP Refrigerants Market, By Type, 2015–2025 (USD Billion) (Kilotons)
19. U.S. Low GWP Refrigerants Market, By Application, 2015–2025 (USD Billion) (Kilotons)
20. Canada Low GWP Refrigerants Market, By Type, 2015–2025 (USD Billion) (Kilotons)
21. Canada Low GWP Refrigerants Market, By Application, 2015–2025 (USD Billion) (Kilotons)
22. Mexico Low GWP Refrigerants Market, By Type, 2015–2025 (USD Billion) (Kilotons)
23. Mexico Low GWP Refrigerants Market, By Application, 2015–2025 (USD Billion) (Kilotons)
24. Europe Low GWP Refrigerants Market, By Type, 2015–2025 (USD Billion) (Kilotons)
25. Europe Low GWP Refrigerants Market, By Application, 2015–2025 (USD Billion) (Kilotons)
26. Germany Low GWP Refrigerants Market, By Type, 2015–2025 (USD Billion) (Kilotons)
27. Germany Low GWP Refrigerants Market, By Application, 2015–2025 (USD Billion) (Kilotons)
28. France Low GWP Refrigerants Market, By Type, 2015–2025 (USD Billion) (Kilotons)
29. France Low GWP Refrigerants Market, By Application, 2015–2025 (USD Billion) (Kilotons)
30. Sweden Low GWP Refrigerants Market, By Type, 2015–2025 (USD Billion) (Kilotons)
31. Sweden Low GWP Refrigerants Market, By Application, 2015–2025 (USD Billion) (Kilotons)
32. Netherlands Low GWP Refrigerants Market, By Type, 2015–2025 (USD Billion) (Kilotons)
33. Netherlands Low GWP Refrigerants Market, By Application, 2015–2025 (USD Billion) (Kilotons)
34. U.K. Low GWP Refrigerants Market, By Type, 2015–2025 (USD Billion) (Kilotons)
35. U.K. Low GWP Refrigerants Market, By Application, 2015–2025 (USD Billion) (Kilotons)
36. Italy Low GWP Refrigerants Market, By Type, 2015–2025 (USD Billion) (Kilotons)
37. Italy Low GWP Refrigerants Market, By Application, 2015–2025 (USD Billion) (Kilotons)
38. Spain Low GWP Refrigerants Market, By Type, 2015–2025 (USD Billion) (Kilotons)
39. Spain Low GWP Refrigerants Market, By Application, 2015–2025 (USD Billion) (Kilotons)
40. Turkey Low GWP Refrigerants Market, By Type, 2015–2025 (USD Billion) (Kilotons)
41. Turkey Low GWP Refrigerants Market, By Application, 2015–2025 (USD Billion) (Kilotons)
42. Switzerland Low GWP Refrigerants Market, By Type, 2015–2025 (USD Billion) (Kilotons)
43. Switzerland Low GWP Refrigerants Market, By Application, 2015–2025 (USD Billion) (Kilotons)
44. Belgium Low GWP Refrigerants Market, By Type, 2015–2025 (USD Billion) (Kilotons)
45. Belgium Low GWP Refrigerants Market, By Application, 2015–2025 (USD Billion) (Kilotons)
46. Asia Pacific Low GWP Refrigerants Market, By Type, 2015–2025 (USD Billion) (Kilotons)
47. Asia Pacific Low GWP Refrigerants Market, By Application, 2015–2025 (USD Billion) (Kilotons)
48. Japan Low GWP Refrigerants Market, By Type, 2015–2025 (USD Billion) (Kilotons)
49. Japan Low GWP Refrigerants Market, By Application, 2015–2025 (USD Billion) (Kilotons)
50. China Low GWP Refrigerants Market, By Type, 2015–2025 (USD Billion) (Kilotons)
51. China Low GWP Refrigerants Market, By Application, 2015–2025 (USD Billion) (Kilotons)
52. India Low GWP Refrigerants Market, By Type, 2015–2025 (USD Billion) (Kilotons)
53. India Low GWP Refrigerants Market, By Application, 2015–2025 (USD Billion) (Kilotons)
54. South Korea Low GWP Refrigerants Market, By Type, 2015–2025 (USD Billion) (Kilotons)
55. South Korea Low GWP Refrigerants Market, By Application, 2015–2025 (USD Billion) (Kilotons)
56. Australia Low GWP Refrigerants Market, By Type, 2015–2025 (USD Billion) (Kilotons)
57. Australia Low GWP Refrigerants Market, By Application, 2015–2025 (USD Billion) (Kilotons)
58. Singapore Low GWP Refrigerants Market, By Type, 2015–2025 (USD Billion) (Kilotons)
59. Singapore Low GWP Refrigerants Market, By Application, 2015–2025 (USD Billion) (Kilotons)
60. Malaysia Low GWP Refrigerants Market, By Type, 2015–2025 (USD Billion) (Kilotons)
61. Malaysia Low GWP Refrigerants Market, By Application, 2015–2025 (USD Billion) (Kilotons)
62. Thailand Low GWP Refrigerants Market, By Type, 2015–2025 (USD Billion) (Kilotons)
63. Thailand Low GWP Refrigerants Market, By Application, 2015–2025 (USD Billion) (Kilotons)
64. Indonesia Low GWP Refrigerants Market, By Type, 2015–2025 (USD Billion) (Kilotons)
65. Indonesia Low GWP Refrigerants Market, By Application, 2015–2025 (USD Billion) (Kilotons)
66. Philippines Low GWP Refrigerants Market, By Type, 2015–2025 (USD Billion) (Kilotons)
67. Philippines Low GWP Refrigerants Market, By Application, 2015–2025 (USD Billion) (Kilotons)
68. South America Low GWP Refrigerants Market, By Type, 2015–2025 (USD Billion) (Kilotons)
69. South America Low GWP Refrigerants Market, By Application, 2015–2025 (USD Billion) (Kilotons)
70. Brazil Low GWP Refrigerants Market, By Type, 2015–2025 (USD Billion) (Kilotons)
71. Brazil Low GWP Refrigerants Market, By Application, 2015–2025 (USD Billion) (Kilotons)
72. Argentina Low GWP Refrigerants Market, By Type, 2015–2025 (USD Billion) (Kilotons)
73. Argentina Low GWP Refrigerants Market, By Application, 2015–2025 (USD Billion) (Kilotons)
74. Colombia Low GWP Refrigerants Market, By Type, 2015–2025 (USD Billion) (Kilotons)
75. Colombia Low GWP Refrigerants Market, By Application, 2015–2025 (USD Billion) (Kilotons)
76. Middle East and Africa Low GWP Refrigerants Market, By Type, 2015–2025 (USD Billion) (Kilotons)
77. Middle East and Africa Low GWP Refrigerants Market, By Application, 2015–2025 (USD Billion) (Kilotons)
78. Saudi Arabia Low GWP Refrigerants Market, By Type, 2015–2025 (USD Billion) (Kilotons)
79. Saudi Arabia Low GWP Refrigerants Market, By Application, 2015–2025 (USD Billion) (Kilotons)
80. UAE Low GWP Refrigerants Market, By Type, 2015–2025 (USD Billion) (Kilotons)
81. UAE Low GWP Refrigerants Market, By Application, 2015–2025 (USD Billion) (Kilotons)
82. Egypt Low GWP Refrigerants Market, By Type, 2015–2025 (USD Billion) (Kilotons)
83. Egypt Low GWP Refrigerants Market, By Application, 2015–2025 (USD Billion) (Kilotons)
84. Nigeria Low GWP Refrigerants Market, By Type, 2015–2025 (USD Billion) (Kilotons)
85. Nigeria Low GWP Refrigerants Market, By Application, 2015–2025 (USD Billion) (Kilotons)
86. South Africa Low GWP Refrigerants Market, By Type, 2015–2025 (USD Billion) (Kilotons)
87. South Africa Low GWP Refrigerants Market, By Application, 2015–2025 (USD Billion) (Kilotons)
List of Figures
1. Global Low GWP Refrigerants Market Segmentation
2. Low GWP Refrigerants Market: Research Methodology
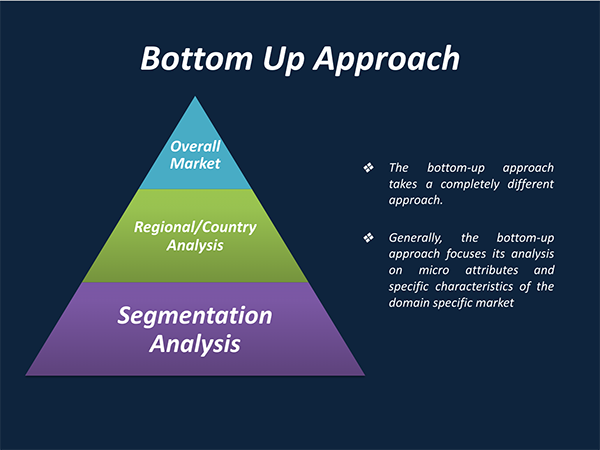
3. Market Size Estimation Methodology: Bottom-Up Approach
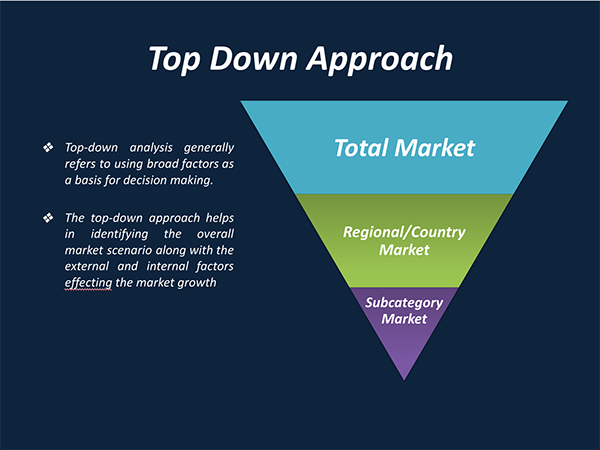
4. Market Size Estimation Methodology: Top-Down Approach
5. Data Triangulation
6. Porter’s Five Forces Analysis
7. Value Chain Analysis
8. Global Low GWP Refrigerants Market attractiveness analysis by Type
9. Global Low GWP Refrigerants Market attractiveness analysis by Application
10. Global Low GWP Refrigerants Market attractiveness analysis by Region
11. Global Low GWP Refrigerants Market: Dynamics
12. Global Low GWP Refrigerants Market Share by Type (2017 & 2025)
13. Global Low GWP Refrigerants Market Share by Application (2017 & 2025)
14. Global Low GWP Refrigerants Market Share by Regions (2017 & 2025)
15. Global Low GWP Refrigerants Market Share by Company (2018)
Market research is a method of gathering, assessing and deducing data & information about a particular market. Market research is very crucial in these days. The techniques analyze about how a product/service can be offered to the market to its end-customers, observe the impact of that product/service based on the past customer experiences, and cater their needs and demands. Owing to the successful business ventures, accurate, relevant and thorough information is the base for all the organizations because market research report/study offers specific market related data & information about the industry growth prospects, perspective of the existing customers, and the overall market scenario prevailed in past, ongoing present and developing future. It allows the stakeholders and investors to determine the probability of a business before committing substantial resources to the venture. Market research helps in solving the marketing issues challenges that a business will most likely face.
Market research is valuable because of the following reasons:
Our research report features both the aspects; qualitative and quantitative. Qualitative part provides insights about the market driving forces, potential opportunities, customer’s demands and requirement which in turn help the companies to come up with new strategies in order to survive in the long run competition. The quantitative segment offers the most credible information related to the industry. Based on the data gathering, we use to derive the market size and estimate their future growth prospects on the basis of global, region and country.
Our market research process involves with the four specific stages.
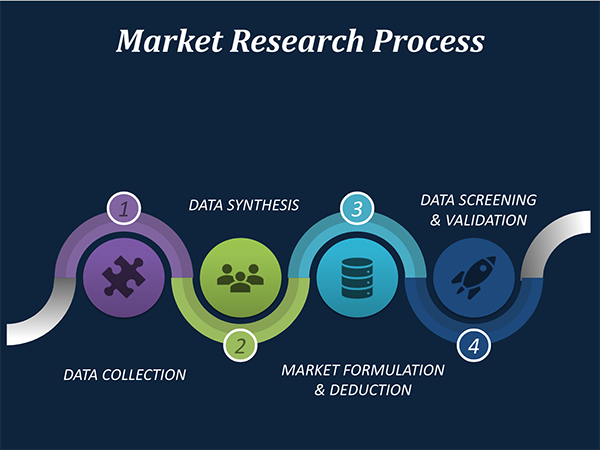
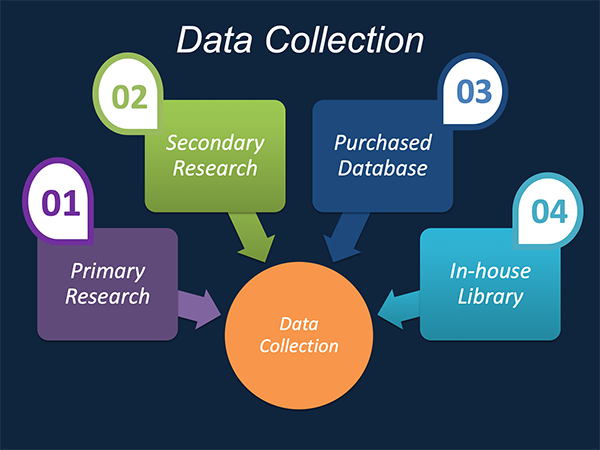
Data Collection: This stage of the market research process involves with the gathering and collecting of the market/industry related data from the sources. There are basically two types of research methods:
Data Synthesis: This stage includes the evaluation and assessment of all the data acquired from the primary and secondary research. It likewise includes in evaluating the information for any disparity watched while information gathering identified with the market. The data & information is gathered with consideration to the heterogeneity of sources. Scientific and statistical methods are implemented for synthesizing dissimilar information sets and provide the relevant data which is fundamental for formulating strategies. Our organization has broad involvement with information amalgamation where the information goes through different stages:
Market Formulation & Deduction: The last stage includes assigning the data & information in a suitable way in order to derive market size. Analyst reviews and domain based opinions based on holistic approach of market estimation combined with industry investigation additionally features a crucial role in this stage.
This stage includes with the finalization of the market size and numbers that we have gathered from primary and secondary research. With the data & information addition, we ensure that there is no gap in the market information. Market trend analysis is finished by our analysts by utilizing data extrapolation procedures, which give the most ideal figures to the market.
Data Validation: Validation is the most crucial step in the process. Validation & re-validation through scientifically designed technique and process that helps us finalize data-points to be used for final calculations. This stage also involves with the data triangulation process. Data triangulation generally implicates the cross validation and matching the data which has been collected from primary and secondary research methods.













































Free Customization
Countries can be added on demand
Free yearly update on purchase of Multi/Corporate User License
Companies served till date

We serve our customers 24x7 for 365 days through calls, emails and live chat options.

Huge database of exceptional market reports bringing market intelligence to your fingertips.

SSL enabled, we offer you various secured payment options for risk free purchase.